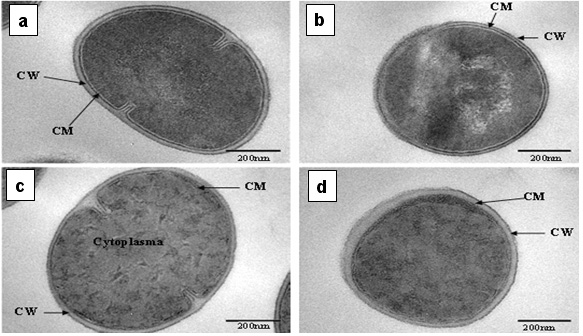
Figure 3. S. aureus TEM pictures (a) and (b) are the control samples; (c) and (d) are triethylsilanol treated samples.