
|
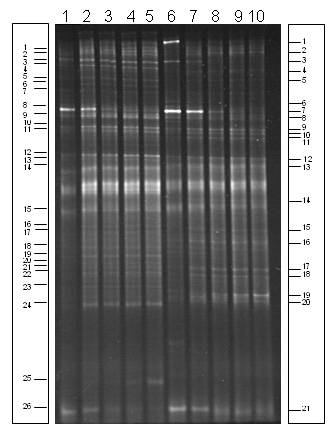
| Figure 4. DGGE patterns produced from V3 region of 16S rRNA gene templates isolated from C. polygonoides plant rhizosphere soil sample (sampling site 1). Fingerprint shows the effect of change in template DNA concentration at PCR level. Taking 25, 100, 500 1000 and 2500 ng DNA template performed the first PCR. Second PCR was performed by taking 1 µl product of the first PCR. Lane 1-5, rhizosphere soil sample amplicons generated at 25, 100, 500, 1000 and 2500 ng DNA template, respectively; Lane 6-10, bulk soil sample amplicons generated at similar DNA template (as above), respectively. |
|
|