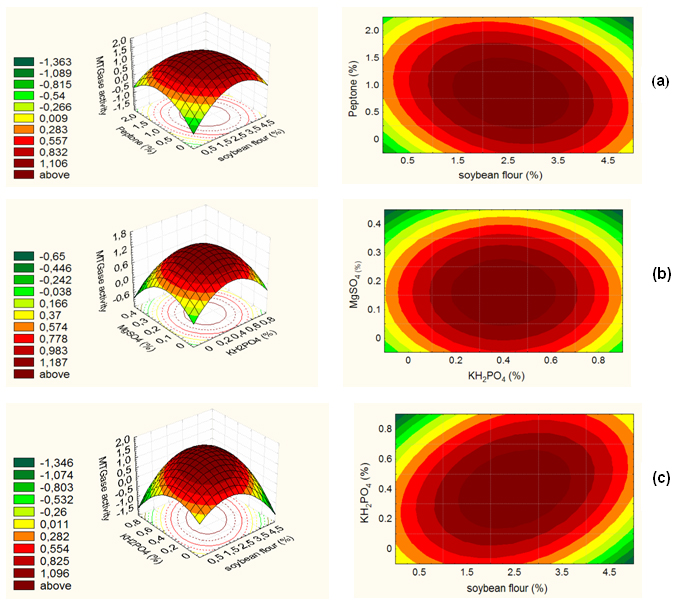
Figure 2. Contour curve and response surface for the MTGase activity as a function of: (a) peptone versus powered soy. (b) MgSO4 versus KH2PO4. (c) KH2PO4 versus soybean flour concentrations, according to the CCD