
|
|
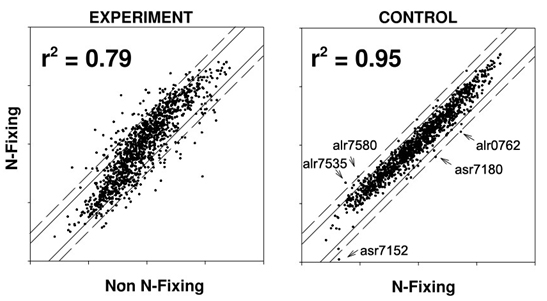
Figure 3. Data quality. For the double-logarithmic plots non-normalized raw data were used. The left plot shows the gene-expression differences between nitrogen fixing (ordinate) and non-nitrogen fixing, ammonia grown (abscissa) cultures of Nostoc PCC 7120. The right plot visualizes the gene-expression differences between two individual nitrogen fixing cultures. Significant outliers are marked by arrows. The straight and dashed lines represent 2-and 3-fold expression differences, respectively. |
|
|