|
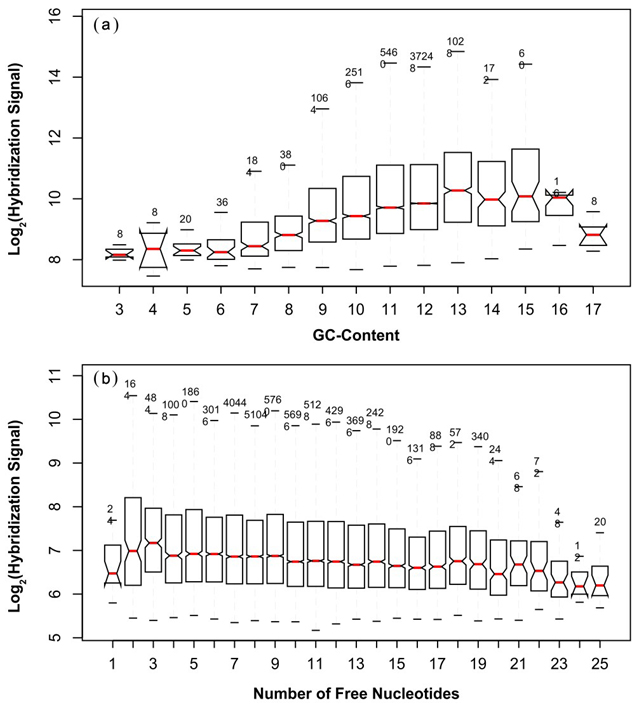
Figure 4. Hybridization effects. The notches around the medians in both box plots (a and b) indicate the 95% confidence interval that the median from one box differs from the median of another box, i.e., if the notches do not overlap the corresponding medians are significantly different. The upper and lower box indicate the second and third quartile, respectively. The plot whiskers extending out from the box to the extreme values. The number above the upper whisker state the number of observations for the corresponding box.
(a) The logarithmized intensity of the hybridization signal is plotted against the GC-content of the 25-mere probe sequence 1.
(b)The logarithmized intensity of the hybridization signal is plotted against the number free secondary structure features (bulges and loops) in the target sequence. |