
|
|
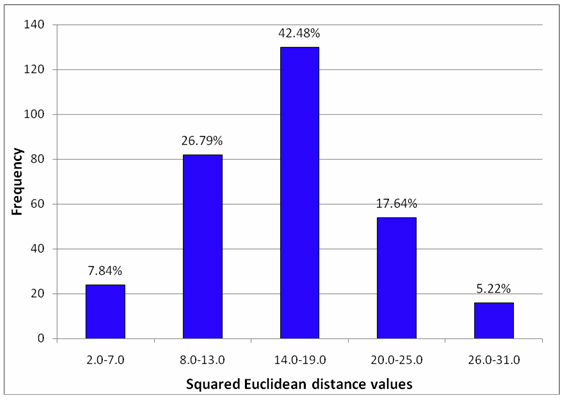
Figure 2. Frequency distribution of Squared Euclidean distance values obtained from pair-wise comparisons between the 18 niger cultivars selected. The vertical axis indicate the number of pair-wise comparisons; values on the bar indicate the percentage of pair-wise Euclidian distance values falling in the frequency classes indicted on the horizontal axis. |
|
|