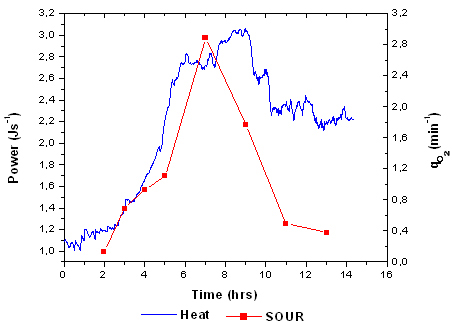
Figure 9. Plot showing the power-time curve (-) and specific oxygen uptake ( ‘■’) of P.aeruginosa cultivated under optimized conditions (Impeller speed 200 rpm, oxygen flow 1 Lmin-1).
 ‘■’) of P.aeruginosa cultivated under optimized conditions (Impeller speed 200 rpm, oxygen flow 1
Lmin-1).
‘■’) of P.aeruginosa cultivated under optimized conditions (Impeller speed 200 rpm, oxygen flow 1
Lmin-1).