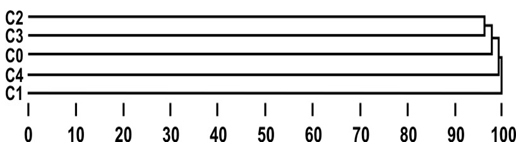
Figure 3. Dendrogram by the single linkage clustering method representing the genetic similarity among the selection cycles (C0, C1, C2, C3 and C4) constructed based on the Nei genetic distance matrix (Reif et al. 2005).