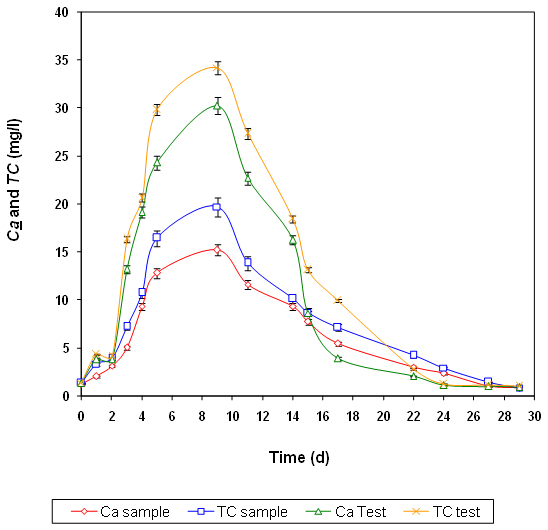
Figure 4. Variation of Ca and TC with time during the experiments carried out with the treated effluent (sample) and synthetic culture media (test).