
|
|
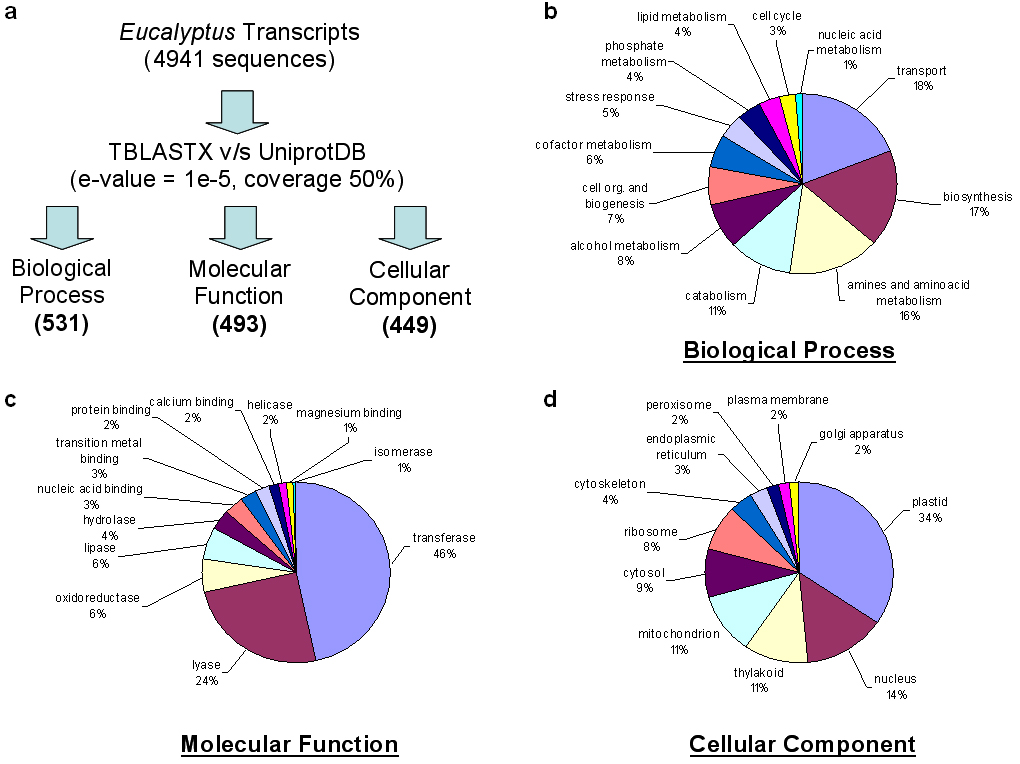
Figure 1. Functional categorization of E. globulus unigenes. (a) Schematic representation of the functional categorization process. (b-d) Distribution of E. globulus unigenes across GO categories. Parent categories and their percentages are shown in bold, sub-categories and the number of deduced proteins is shown in parenthesis. |
|
|