|
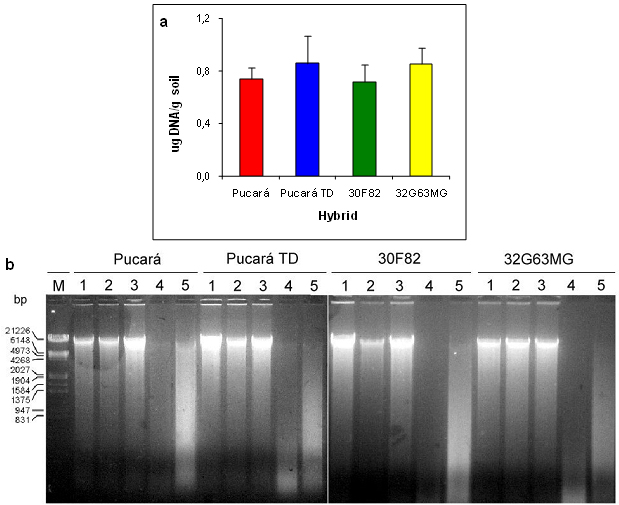
Figure 2. DNA isolated from soil samples.
(a) Mean yield of DNA extracted from each cornfield
(bars correspond to SD).
(b) Samples derived from each cornfield at intervals
of three months: (1-5), February, May, August and November 2002, and March
2003; (M), molecular marker. |