
|
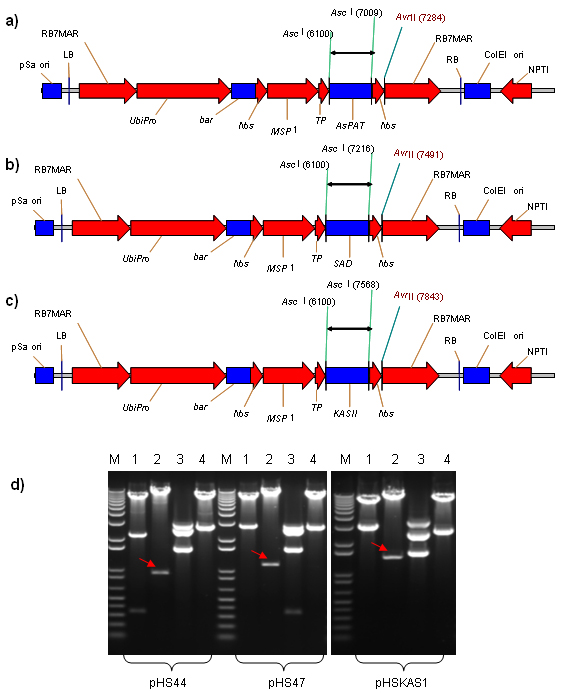
Figure 4. Schematic diagram of single transformation vectors, a) pHS44 (10908 bp), b) pHS47 (11115 bp) and c) pHSKAS1 (11467 bp). The restriction sites and the numbers indicate the approximate position in the vectors. The double head arrows indicates the size of fragments digested with AscI for 909 bp (7009 bp-6100 bp) of antisense palmitoyl-ACP-thioesterase (AsPAT), 1116 bp (7216bp-6100bp) of sense Δ9-stearoyl-ACP-desaturase (SAD), 1468 bp (7568 bp-6100 bp) of sense β-ketoacyl-ACP-synthase II (KASII). Restriction endonuclease analysis, lanes 1: SpeI, 2: AscI, 3: BglII, 4: NheI, for pHS44, pHS47 and pHSKAS1 as in d. Red arrows indicate the inserted genes. Lane M is 1 kb plus DNA ladder. |
|
|