Figure
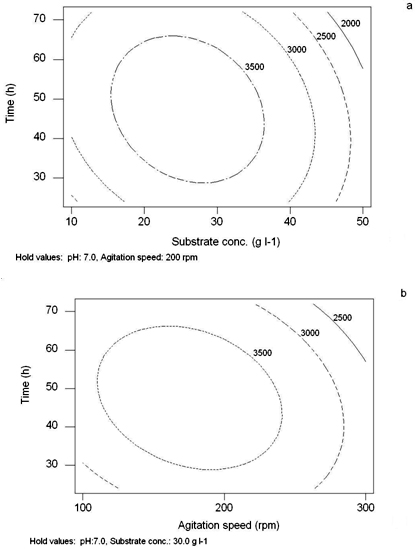
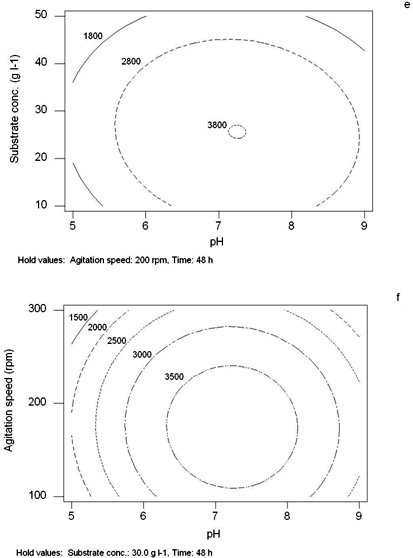
3. Contour plots for specific β-galactosidase enzyme activity at
varying concentrations of:
(a)
time and substrate conc.
(b)
time and agitation speed.
(c)
substrate conc. and agitation speed.
(d)
time and pH.
(e)
substrate concentration and pH.
(f)
agitation speed and pH at a constant middle level of the other two factors.
|