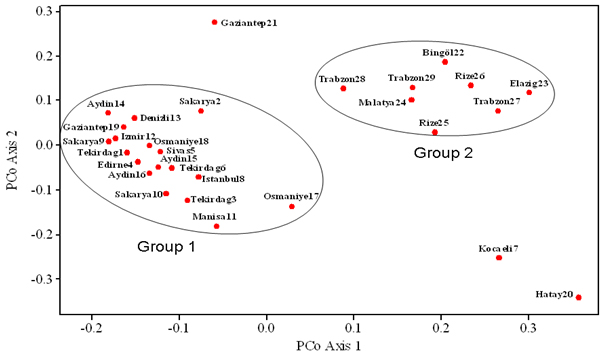
Figure 2. Distribution of 29 Cannabis accessions by 2-dimensional principal coordinate analysis. PCo axis 1 and PCo axis 2 account for 13.9% and 7.7% of the variation, respectively.