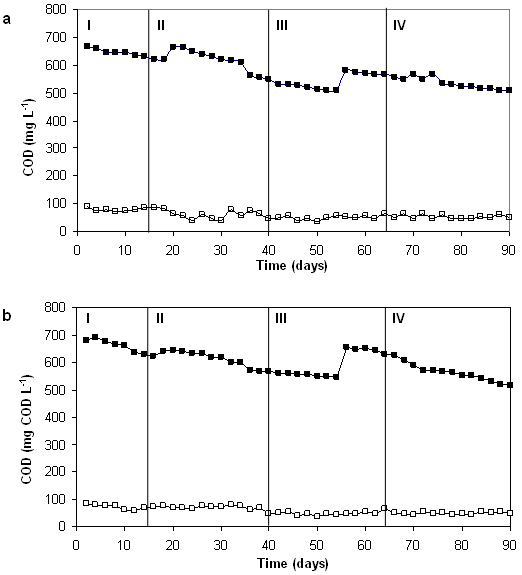
Figure 2. Variation of the CODt in the influent (■) and effluent (□) of the GCC (a) and UASB (b) reactors. See Table 3 for the characteristics of each operational phase.