|
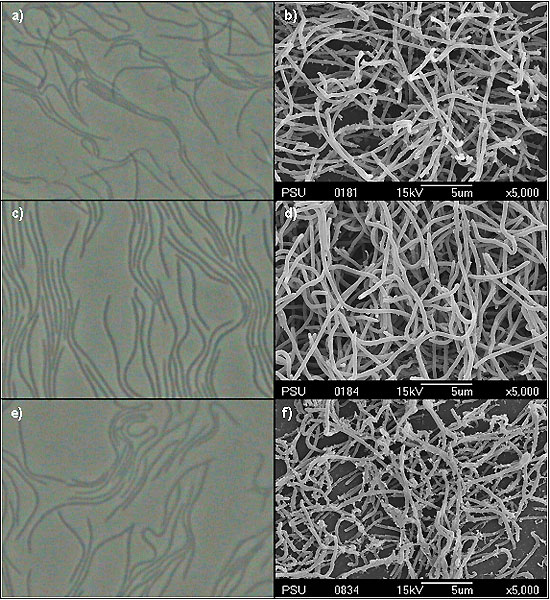
Figure 2. Cell morphology under a phase contrast and a scanning electron
microscopes of TISTR1761 and TISTR1781.
a-b) Phase
contrast (x100), bar = 10 µm, and scanning
electron micrographs of TISTR1761 (AB433333), bar = 5 µm, cultivated
on SAP2 agar.
c-d) Phase
contrast (x100), bar = 10 µm, and scanning
electron micrographs of TISTR1781 (AB443430), bar = 5 µm, cultivated
on SAP2 agar.
e-f) Phase
contrast (x100), bar = 10 µm, and scanning
electron micrographs of TISTR1768 (AB444610), bar = 5 µm, cultivated
on SAP2 agar. |