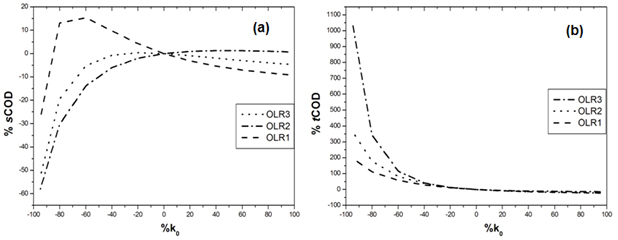
Figure 6. Variation (%) of soluble (a) and total (b) COD concentrations at the end of the reaction time with k0 at the three OLRs studied. Results obtained during model validation were used as reference.