|
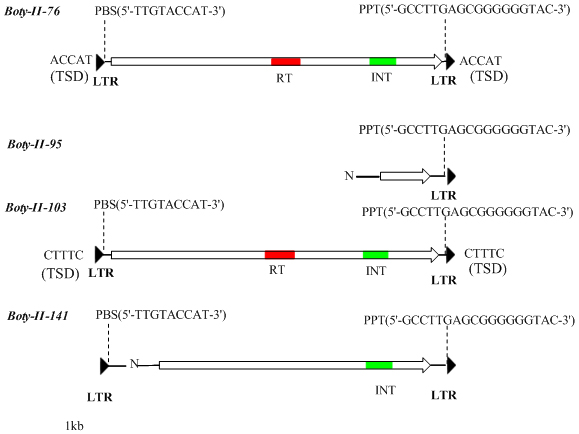
Figure 1. Diagram of Boty-II. DNA
is depicted by  , Putative
genes are depicted with the , Putative
genes are depicted with the , LTRs are indicated with , LTRs are indicated with , the
putative reverse transcriptase domain (RT) is indicated with , the
putative reverse transcriptase domain (RT) is indicated with  , the putative DDE integrase (INT) domain is indicated
with , the putative DDE integrase (INT) domain is indicated
with  , and N indicates gaps in the
genomic sequence. , and N indicates gaps in the
genomic sequence. |