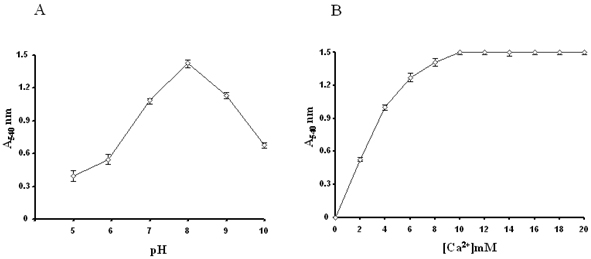
Figure. 4.
Enzyme activity of recombinant MtsPLA2.
(a)
Graph showing the optimum pH. Data shows the values as mean ± standard
error from three experiments with duplicate readings.
(b) Graph
showing the calcium dependence of recombinant MtsPLA2 for
its activity. Data shows the values as mean ± standard
error from three experiments with duplicate readings.
|