|
Figure
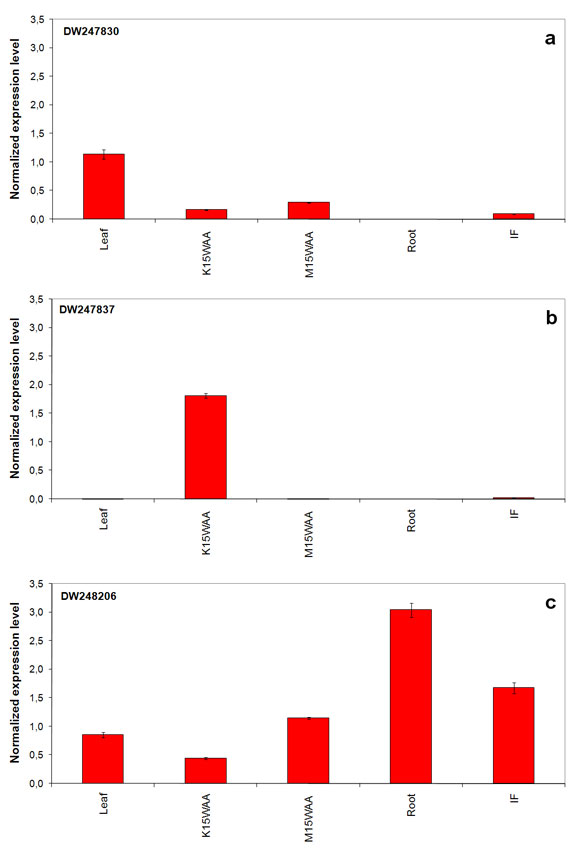
4. Group of genes with tissue-specific expression in various
tissues of oil palm. Expression profiles
of these genes were validated across five tissues using quantitative
real-time PCR. Normalized expression level was calculated from
the mean values of 2 amplification reactions and the error bars
represent ± standard deviation. Leaf
(spear leaves), K15WAA (kernel at 15 weeks after anthesis), M15WAA
(mesocarp at 15WAA), root (roots from seedling palms) and IF
(young inflorescences).
(a) DW247830 (Putative
transcription factor Myb 1).
(b) DW247837 (Putative germin
A).
(c) DW248206 (Putative late
embryogenesis abundant protein). |