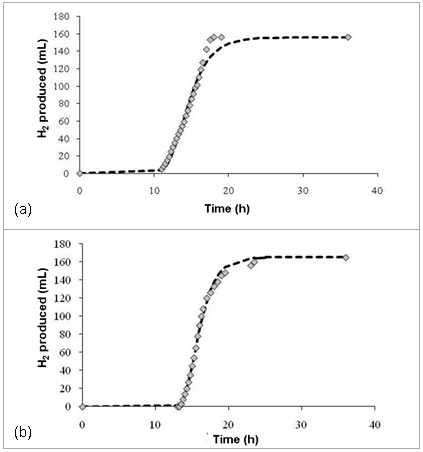
Figure 1. Profiles of hydrogen produced at two different initial pHs: (a) pH 5.5 and (b) pH 7.5. Initial glucose concentrations in both trials were 5 g COD/L. indicates experimental data while ▬ ▬ indicates data predictedby the Gompertz model.