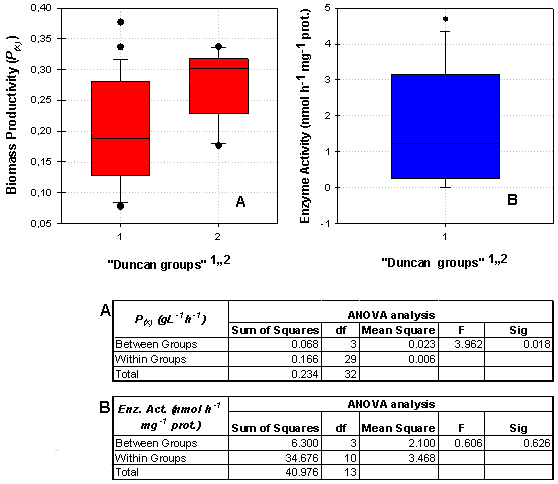
Figure 2. Duncan test (graphics A and B) and One-way ANOVA (tables A and B) comparing the treatments T3, T4, T7 and T8: A. biomass productivity (P(x) as gL-1 h-1), B. enzyme activity (Enz. Act. as nmol h-1 mg-1 prot).