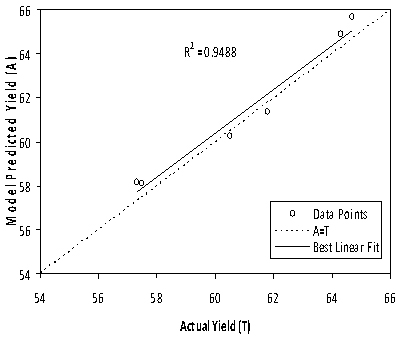
Figure 6. The scatter plot of ANN predicted yield
versus
actual yield for validation data.
Supported by
UNESCO
/
MIRCEN
network
Home
|
Mail to Editor
|
Search
|
Archive