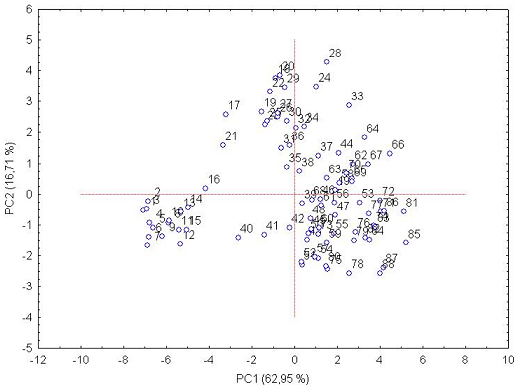
Figure 4. Score plots (PC1 * PC2) of PCA carried out on the E-nose responses of a T306 fermentation. Samples were numbered according to time and one analysis was carried out every 30 min.