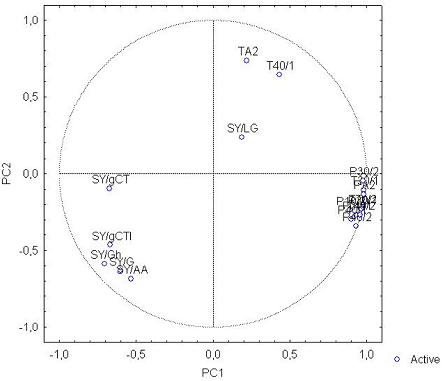
Figure 5. Loading plot of all variables in the plane defined by PC1 * PC2. Data used in PCA corresponded of the E-nose responses from one T306 fermentation.