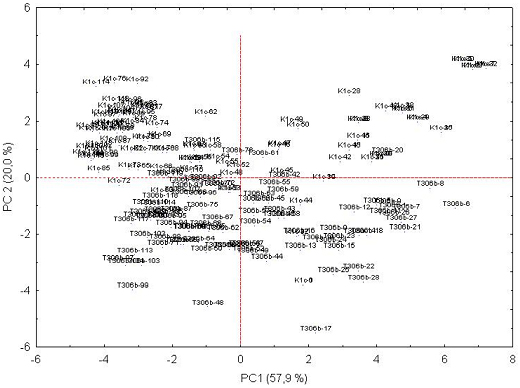
Figure 7. Score plots (PC1 * PC2) of PCA carried out on the E-nose responses for a T306 fermentation and an ICV-K1 fermentation. The E-nose responses were "normalized" as detailed in the text.