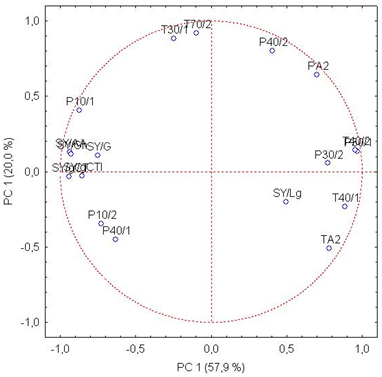
Figure 8. Loading plot of all variables in the plane defined by PC1 * PC2. Data used in PCA corresponded of the E-nose responses for a T306 fermentation and an ICV-K1 fermentation. The E-nose responses were "normalized" as detailed in the text.