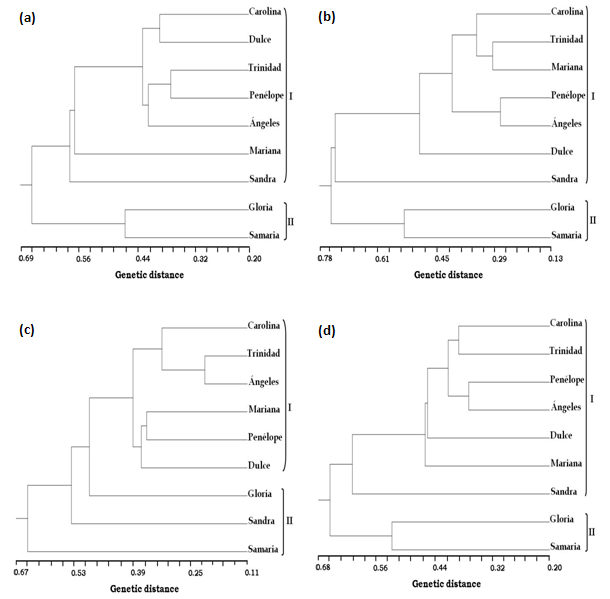
Figure 2. Dendogram generated using UPGMA analysis, showing relationships between nine varieties of T. pavonia, based on RAPD data of 10 (a), 15 (b), 20 (c) and the pooled (10, 15 and 20) base of length primer (d).