
|
|
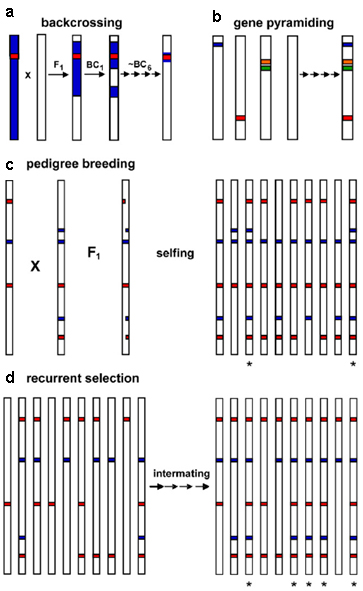
Figure 1. Common plant breeding and selection schemes. Each vertical bar is a graphical representation of a chromosome of an individual within a breeding population, with colored segments indicating genes and/or QTLs that influence traits under selection. Genes associated with different traits are shown in different colors (e.g. red, blue). ‘‘X’’ indicates a cross between parents, and arrows depict successive crosses of the same type. Asterisk below an individual signifies a desirable genotype. (a) In backcrossing scheme, a donor line (blue bar) is crossed to an elite line for transferring a specific gene of interest (red). Selected progenies were repeatedly backcrossed to the elite parent with each backcross cycle involving selection of individuals with the gene of interest and of the highest proportion of elite parent outside the target genome. (b) In gene pyramiding, genes or QTLs associated with different beneficial traits (blue, red, orange, green) are combined into the same genotype via crossing and selection. (c) In pedigree breeding, two individuals with desirable and complementary phenotypes are crossed; F1 progeny are self-pollinated to fix new, improved genotype combinations. (d) In recurrent selection, a population of individuals (10 in this example) segregate for two traits (red, blue), each of which is influenced by two major favorable QTLs. Intermating among individuals and selection for desirable phenotypes/genotypes increases the frequencies of favorable alleles at each locus. For this example, no individual in the initial population had all of the favorable alleles, but after recurrent selection half of the population possesses the desired genotype (Moose and Mumm, 2008). |
|
|