
|
|
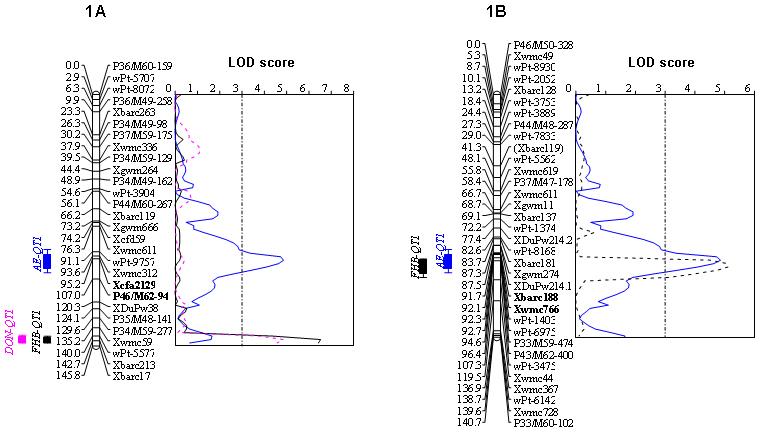
Figure 2. A likelihood-ratio test statistic (LOD score) plot of hexaploid wheat chromosomes 1A and 1B showing QTLs for Fusarium head blight (FHB) resistance (black dotted line), anther extrusion (AE, solid blue line) and deoxynivalenol (DON) accumulation (pink dashed line). LOD scores were obtained for mean phenotypic dataset using composite interval mapping. QTL graphs and a threshold of LOD 3.0 are shown on the right of each chromosome. Genetic distances are shown in centimorgans (cM) on the left of each chromosome. The flanking markers for anther extrusion as an example are shown in bold face (Semagn et al. 2007; Skinnes et al. 2010). |
|
|