
|
|
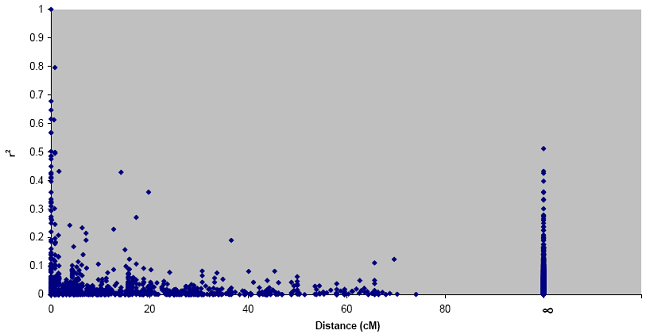
Figure 9. Linkage disequilibrium (LD) decay plot. The squared correlation between paired marker intensities on the y-axis is plotted against the distance between pairs of markers in centi-Morgan (cM) on the x-axis. LD between pairs of markers on different non-homologous chromosomes is represented by the symbol ∞. The commonly accepted reference value for r2 of 0.1 indicates LD to decay at about 3 cM. The critical test value for r2 is 0.03 for a test level of 0.01. Using this critical value as threshold, LD decays at about 8 cM (D'Hoop et al. 2008). |
|
|