
|
|
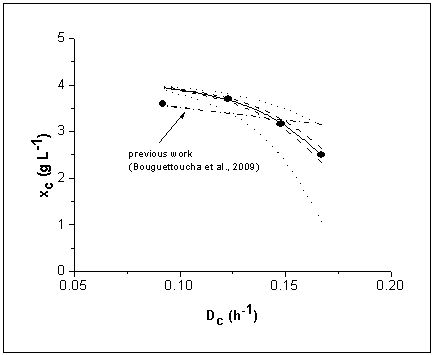
Figure 1. Biomass concentrations at steady-state in the second stage of the system: experimental (symbols) and calculated (continuous lines) by means of the previous growth model (Bouguettoucha et al. 2009) (Equation 8) (dash dot) and by means of the modified growth model (Equation 9) (solid line). Parametric sensitivity of the modified growth model (Equation 9) upon parameters α (a) and β (b). Experimental (symbols) and calculated biomass data at steady-state in the second stage of the system by considering the optimal parameter values (continuous line), and by considering +10 (dash line) and -10 (dot line) % variation of the considered parameter. Values collected in Table 1 were considered for the other parameters. |
|
|