|
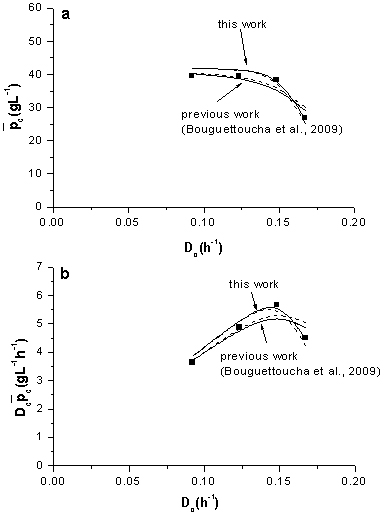
Figure 2. Experimental
(symbols) and calculated (continuous lines) lactic acid concentrations  (a) and volumetric
productivity Dc , (b) at steady-state in
the second stage of the system after optimization of growth- (Ac) and
non-growth-associated (Bc) production parameters by means of
the substrate limitation (Equation 12) and the generalized (Equation 16) models,
as well as the previous model (Bouguettoucha et al. 2009). (a) and volumetric
productivity Dc , (b) at steady-state in
the second stage of the system after optimization of growth- (Ac) and
non-growth-associated (Bc) production parameters by means of
the substrate limitation (Equation 12) and the generalized (Equation 16) models,
as well as the previous model (Bouguettoucha et al. 2009). |