
|
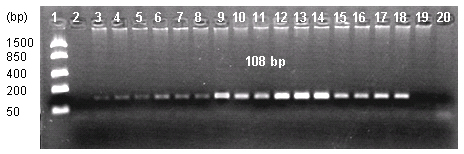
Figure 3. Semi-quantitative analysis of RT73 rapeseed content in feed samples. In line 1 molecular weight marker; line 2 blank, lines 3-14 represent the calibration curve in range 0.05 to 1% of RT73 content (3-5 0.05%, 6-8. 0.1%, 9-11 0.5%, 12-14 1%); lines 15-18 RT 73 positive feed samples, lines 19-20 negative controls. |
|
|