|
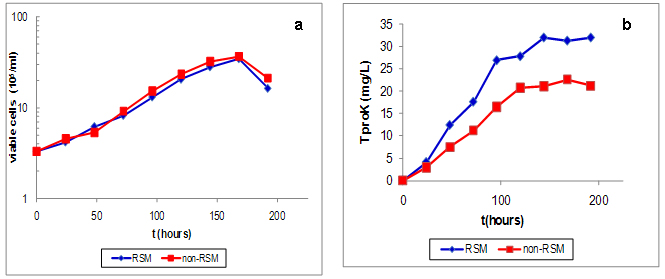
Figure 2. RSM and non-RSM-optimized post-transfection
expression of TproK in shaker flasks.
(a) Cell growth curves in the post-transfection culture with RSM
and non-RSM-optimized methods.
(b) TproK increase curves in the post-transfection culture with
RSM and non-RSM-optimized methods. |