
|
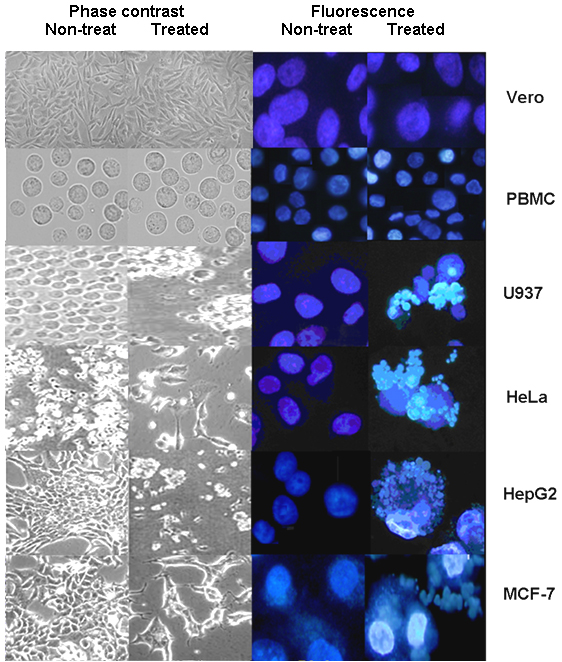
Figure 3. Cell morphology and DNA staining of normal cells (Vero and PBMC) and various cancer cells after 48 hrs of treatment with 500 µg/ml ofYs102, B92, B151 and B100 crude extracts (treated), running from top and 0.01% ethanol (vehicle control, untreated) observed under phase contrast microscope (left panel) and fluorescence inverted microscope (right panel) at the magnification of 400X. |
|
|