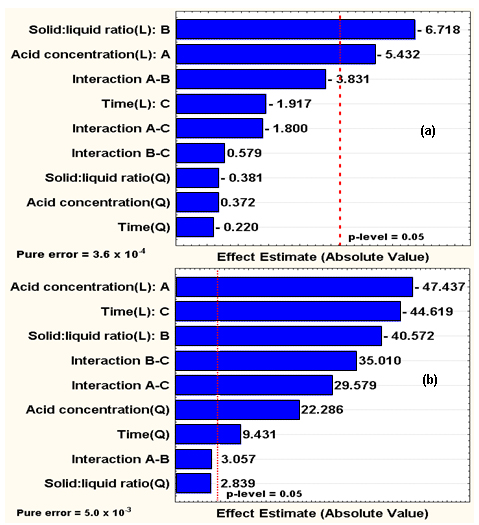
Figure 3. Pareto charts of standardized effects for (a) ethanol yield and (b) ethanol/xylitol ratio (g/g). (L): Linear effect; (Q): Quadratic effect.