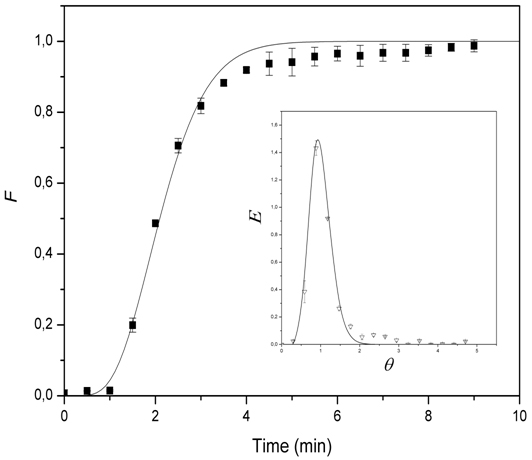
Fig. 6 Representative F and E curve in FBR. Flow rate of 10 mL min-1, N = 13. Symbols represent experimental data. Lines represent predictions of the tank in series model.