|
Fig.
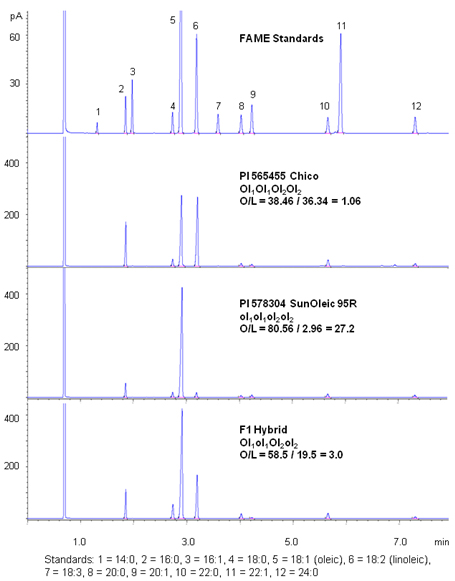
1 (a) Chromatogram showing the fatty acid composition of three different ol genotypes (Ol1Ol1Ol2Ol2, Ol1ol1Ol2ol2,
and ol1ol1ol2ol2,). The x-axis
represents the retention time. Eight fatty acids were revealed for each sample;
however, palmitic (C16:0), oleic (C18:1), and linoleic (C18:2) were the
predominant fatty acids detected in these samples.
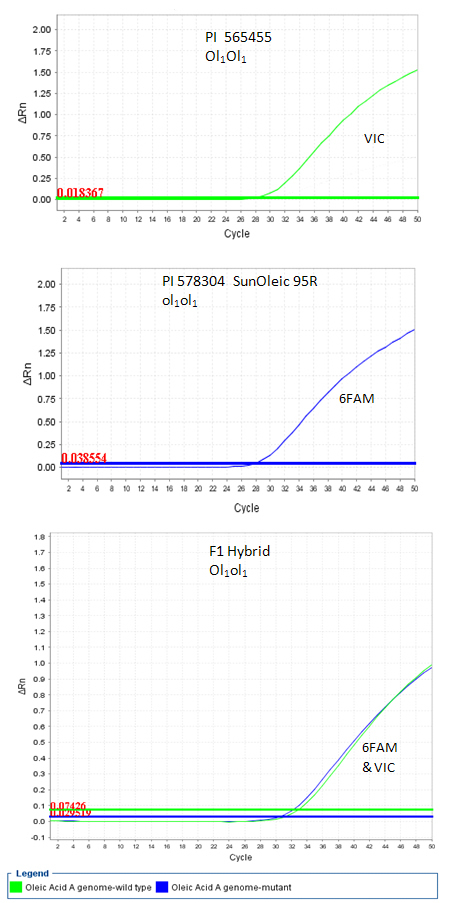
(b) Amplification plots of the three FAD2A genotypes (Ol1Ol1, ol1ol1, and Ol1ol1)
detected with real-time PCR using two TaqMan® probes to target the
wild type and mutant allele (G448A) in FAD2A. The first
amplification plot shows the homozygous dominant genotype, the middle plot is
homozygous recessive, and the bottom plot is heterozygous. The x-axis
represents the cycle number; whereas, the y-axis represents the normalized
fluorescence. |