
|
|
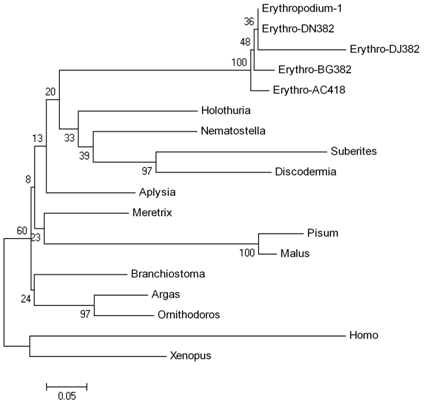
Fig. 1 Evolutionary relationships of ferritin of 18 taxa inferred from amino acid sequences using the Minimum Evolution (ME) method (Rzhetsky and Nei, 1992). The bootstrap consensus tree inferred from 100 replicates is taken to represent the evolutionary history of the taxa analyzed. The percentage of replicate trees in which the associated taxa clustered together in the bootstrap test (100 replicates) is shown next to the branches (Felsenstein, 1985). The tree is drawn to scale, with branch lengths equal to the evolutionary distances used to infer the phylogenetic tree. The evolutionary distances were computed using the Poisson correction method (Zuckerkandl and Pauling, 1965) and are in the units of the number of amino acid substitutions per site. The ME tree was searched using the Close-Neighbor-Interchange (CNI) algorithm (Nei and Kumar, 2000) at a search level of 3. All positions containing gaps and missing data were eliminated from the dataset (complete deletion option). There were a total of 107 positions in the final dataset. Phylogenetic analyses were conducted with MEGA4 (Tamura et al. 2007). Erythropodium accession numbers are listed in the text, while accession numbers for reference sequences are as follows: Nematostella vectensis - XP_001632011; Aplysia californica - ABF21074.1; Suberites ficusgi - CAG25529.1; Dermatophagoides pteronyssinus AAG02250; Argas monolakensis - ABI52633; Holothuria glaberrima - ABS29643; Ornithodoros parkeri - ABR23389; Meretrix meretrix - CAB72315; Dermacentor andersoni - AAG02250.1; Pisum sativum - CAA51786.1; Xenopus laevis - AAB20316.1; Branchiostomagi belcheri - AAQ21039.1; Malus xiaojinensis - AAK83702.1|AF315505_1; Homo sapiens - CCDS33070.1. |
|
|