|
Natural selection in common bean microsatellite alleles and identification of QTLs for grain yield Monik Evelin Leite1 · João Bosco dos Santos*1 · Flávia Fernandes Carneiro1 · Karla Rodrigues Couto1 1Departamento de Biologia, Universidade Federal de Lavras, Lavras, MG, Brasil *Corresponding author: jbsantos@ufla.br Financial support: National Council of Technological and Scientific Development (CNPq) and Coordination for the Improvement of Higher Education Personnel (CAPES). Keywords: bulk method, fitness coefficient, Phaseolus vulgaris, SSR markers.
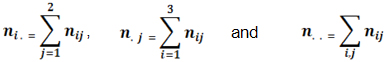
Natural selection acts to select better adapted individuals or alleles in segregating population and help plant breeding. The objective of this work was to verify the effect of natural selection on microsatellite alleles as indicators of better adaptation and identification of quantitative trait loci (QTLs) for grain yield. This study evaluated 107 progenies from the F8 and 107 from the F24 generation derived from crossing Carioca MG and ESAL 686 lines, carried out by the bulk method, and evaluated in three different seasons: winter 2001; rainy 2001 and dry 2002. It was utilized 22 polymorphic markers and the natural selection acted in all of them. The frequency of the alleles of the parent Carioca MG, the most adapted, was increased in all of the 22 loci in F8 and 19 loci in F24. Selection affected each locus with different intensities in different generations. All of the selected alleles can be important for breeding program. QTLs were identified in generation F8 and F24 at varied magnitudes. The best marker PVttc002 explained 11.76% of variation in grain yield. However, an elevated interaction between QTLs and the environments was observed, showing the great difficulty in assisted selection. In the segregant population of common bean (Phaseolus vulgaris), advanced by bulk method, the natural selection maintains the individuals in the population with favorable characteristics for the environment in which they are found, contributing to their better adaptation. Grain yield, just as the majority of economically important characteristics, is affected by natural selection. Considering this trait one of the breeding methods that is most affected by natural selection is the bulk which maintains the most adapted individuals (Allard, 1999). Natural selection can offer benefits to those who wish to improve plant traits such as yield and disease resistance, but in some cases such as growth habit and size of seeds, it can be disadvantageous, and artificial selection is necessary in these cases (Allard, 1999). Molecular markers affected by natural selection can be an important alternative for selection of better adapted alleles (Allard, 1999). These markers can be identified from alteration in their allele frequencies, with the prevailing allele in advanced generations explaining the best adaptation, as observed by Rodrigues and Santos (2006). Molecular markers can also be used as a tool to aid in the selection process of quantitative traits in which environmental influence is greater, such as grain yield. Better contribution of these markers is expected because of the difficulties involved in the selection process (Silva and Vencovsky, 2002). However, the results observed are not always the most promising (Blair et al. 2006; Rodrigues et al. 2007; Torga et al. 2010). The objective of this work was to identify microsatellite markers (SSR) selected by natural selection in segregating bean populations advanced by the bulk method and to identify markers related to grain yield. A segregant population that came from the crossing Carioca MG and ESAL 686 genitors was used. Carioca MG is a variety with small cream-colored beans with brown stripes, undetermined type II growth habit and carries the Co-2 allele, which confers resistance to some types of the Colletotrichum lindemuthianum fungus, which causes anthracnose. ESAL 686 has determined type I growth habit, it has big and yellow beans, short cycles (80 days) and is resistant to angular leaf spot (Pseudocercospora griseola). Beginning with the crossing of Carioca MG and ESAL 686 lines, the segregant F2 population was carried forward in bulk until generation F8, from which a sample of 107 plants was taken (Silva et al. 2004). The rest of the population continued to be carried forward until F24, at which time another 107 plant samples were taken. The segregant population was advanced by the bulk method. At each generation, after harvest, a sample of around 2000 bean seeds was stored in a cold chamber to be used for obtaining the next generation. For this study, two parents and 107 progenies descended from each generation F8:11 and F24:27, were also utilized by Silva et al. (2004), Rodrigues and Santos (2006) and Rodrigues et al. (2007). Fifteen beans from each progeny were planted in a tray for DNA extraction as in Rodrigues and Santos (2006). Polymorphic chain reactions (PCR) were carried out with 135 pairs of microsatellite markers, whose sequences are published by Blair et al. (2003), Caixeta et al. (2005) and Hanai et al. (2010). The PCR reaction began with DNA denaturation at 95ºC for 2 min followed by 32 cycles of denaturation at 94ºC for 20 sec, annealing at 42 to 64ºC (depending on the primer) for 20 sec, and elongation at 72ºC for 20 sec, with a final elongation at 72ºC for 10 min. After amplification the reaction products were separated by polyacrylamide gel (6 to 8%) electrophoresis, stained with silver nitrate and photographed with a digital camera (Benbouza et al. 2006). Genotyping of F8 and F24 progenies was carried out with twenty-two loci that had polymorphism in the genitors and an equal mixture of DNA from F24 progenies. For each microsatellite locus, the genotypic proportions of both generations were compared by means of the x2 test, considering A1 the allele from the Carioca MG genitor and A2 from the ESAL 686 genitor. Thus, at the jth segregant population, with j = 1 corresponding to F8 and j = 2 corresponding to F24, the ith genotypes occur, with i = 1 corresponding to A1A1, i = 2 corresponding to A1A2, and i = 3 corresponding to A2A2. With the number of the ith genotype observed in the jth generation represented by nij, the corresponding number expected is given by:
x2 was
estimated with two degrees of freedom, that is, the product of the number of
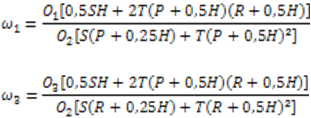
populations minus one by the number of genotypes per progeny minus one. Considering that the natural crossing rate of beans in the region is approximately T = 0.005 (Pereira Filho and Cavariani, 1984) and the corresponding self-fertilization rate is S = 1-T = 0.995, the genotypic frequencies for each primer pair (locus) were estimated. Thus, with A1 and A2 the alleles of each locus, genotypic frequencies estimated in generations n and n + 1 are given by the following expressions (Allard, 1999; Rodrigues and Santos, 2006): Freq (A1A1) = f1(n+1) = S[f1(n) + 0.25f2(n)] + T[ f1(n 0.5f2(n)]² Freq (A1A2) = f2(n+1) = S[0.5f2(n)] + 2T[f1(n) +0.5f2(n)][f3(n) +0.5f2(n)] Freq (A2A2) = f3(n+1) = S[f3(n) + 0.25f2(n)] + T[f3(n) + 0.5f2(n)]² Considering the relative adaptability coefficient of genotype A1A1 as ω1 of genotype A2A2 as ω3 and of genotype A1A2 as ω2 = 1, the accumulated relative adaptability coefficients of F2 to F8 and F8 to F24 were estimated by means of the expressions (Allard and Hansche, 1964):
In which: P and O1 are the proportions of A1A1 in generations n and n + 1, respectively; H and O2 are the proportions of A1A2 in generations n and n + 1; and R and O3 are the proportions of A2A2 in generations n and n + 1. The genotypic proportions in generation n are expected to be the same as those in generation F7 if there is no natural selection, taking into consideration the rates of 0.005 crossing and 0.995 self-fertilization. While in F23, these are the proportions expected beginning from the proportions observed at F8, also taking into consideration the absence of natural selection and the rates of crossing and self-fertilization. The progenies were also evaluated for grain yield by Silva et al. (2004) in three seasons: winter 2001 (F8:9 and F24:25), planted in August in Ijaci using a simple 18 x 18 square lattice design, and plot with one meter row with 0.5 m spacing, with a density of 15 seeds; the rainy season in 2001 (F8:10 and F24:26), planted in November 2001 and the dry season of 2002 (F8:11 and F24:27), planted in March 2002, the latter two both in Lavras using a triple 18 x 18 square lattice design, and plot with two meter rows with 0.5 m spacing and a density of 15 seeds per meter. In all seasons, grain weight per plot was evaluated. Simple and multiple linear regression analyses were carried out with the genotyping results, with model selection by the backward method for each of the 22 markers, with average grain yield data at each generation per season and also the mean grain yield of all seasons.The analyses were set up using SAS 8.0 version software. Among the 135 primer pairs utilized, 22 had polymorphism between the parents and the bulk of generation F24, as shown by the PVatt003 and AJ416395 primers (Figure 1 and Figure 2).Thirteen of the primers chosen were mapped on seven different chromosomes and for the rest the position of the genome is unknown. In the absence of natural selection, the expected proportions, considering T = 0.005 and S = 0.995 and according to the expressions in Allard (1999) are 0.4938 A1A1, 0.0124 A1A2, and 0.4938 A2A2 for F8, and for F24 they are 0.4975 A1A1, 0.0050 A1A2,and 0.4975 A2A2, considering homozygous parents. The expected proportions in situations in which one of the parent has a locus in heterozygosis for F8 are 0.244382 A1A1, 0.011237 A1A2,and 0.744382 A2A2 and for F24 are 0.248134 A1A1, 0.003731 A1A2, and 0.748134 A2A2. Considering these expected proportions for the genotypes at each generation, the differences between them are not statistically significant. This therefore shows that natural selection acted on all of the microsatellite loci (Table 1). It is noted that the effect of natural selection occurred in both the first self-fertilized generation up to F8 and the more advanced generations, since they differed in 19 of the 22 loci. For the three loci that were not affected by natural selection from F8 to F24, the markers amplified by primers BMd-33, PVatt003 and PvM15, natural selection was accentuated in the first segregant generations, favoring selection of genotype A1A1, identical to the best adapted parent. Since the primers are mapped in seven different bean chromosomes, it can be inferred that natural selection took place throughout the genome. An interesting result was the heterozygosis found in the Carioca MG parent for the three primers utilized (BMd-15, BMd-16, and PvM13). In addition to showing that the line (cultivar) were not totally pure, it was observed that even after several generations of self-fertilization, the cultivar maintain genetic variability through heterozygosis (Allard and Hansche, 1964). It is also noted that heterozygosis maintained a much greater frequency than expected for the three loci and the homozygote genotype with the Carioca-derived allele remained superior for two of the markers, especially at F24 (Table 3). For the PvM13 marker, the great majority of the progenies remained in heterozygosis, clearly indicating the adaptive advantage of this genotype or, more precisely, the region of the genome marked by this locus (Table 1). These observations show the superiority of the Carioca parent in relation to adaptation and also that heterozygosis can be maintained at a high frequency, even after a large number of successive self-fertilizations in a segregant population, when this genotype is favourable. Since both populations originated from a biparental crossing, and the majority of genitor loci are homozygotes, it can be deduced that the allele frequencies in the segregant loci were 0.5 in generation F2. In the case of heterozygote loci in one parent, a frequency of 0.75 can be deduced for the allele that is found in both parents and 0.25 for the allele found in only one parent, as in the case of Carioca MG. The frequencies should remain unaltered in the absence of natural selection. Note that in F8 (Table 2), in all of the microsatellite loci there was an increase in frequency of the allele coming from the Carioca MG parent in relation to what was expected, even for the loci in which Carioca MG had two alleles, indicating that natural selection favored the plants that carried these alleles. In locus PvM 13, the allele from the ESAL 686 genitor was more common, although this frequency was much less than expected. In the F24 population (Table 2), all 22 loci were affected by natural selection. In 21 of the loci, the Carioca MG genitor alleles appeared more frequently. For the PvM13 primer, the ESAL 686 parent allele was slightly more common, as observed in F8, because of the predominance of the heterozygote resulting in allele frequencies around 0.5 (Table 1 and Table 3). Comparing populations F8 and F24, their allele frequencies were different in 21 loci, except for PvM13, showing that natural selection was active not only until generation F8, but also from F8 to F24, maintaining the Carioca genitor allele in greater amounts. However, apparently natural selection for loci Pvtaaa003 and PVttc002 was more intense until F8 and reversed direction from F8 to F24, while the Carioca allele became even more predominant in this late generation. In this case the first marker did not exhibit heterozygosis and the apparent inverse selection effect took place in the homozygotes, while in the latter, selection effect mainly increased heterozygote frequency. However, in both, the ESAL 686 allele genotype was favoured in more advanced generations. Changes in allele frequency could take place because of the sampling effect; however, in the present study each generation came from 2,000 bean plants from the previous generation, minimizing this effect. Nonetheless, when 107 progenies were taken as samples for the two populations, the sampling effect became a little more important since allele frequency oscillation of 0.03 or less could have taken place by chance with a 0.05 probability (Rodrigues and Santos, 2006). Thus the majority of oscillations were mainly due to the effect of natural selection. These effects were specific for each locus and generation, even including reverse selection as was also observed in various monogenetic traits as well as in isozyme loci (Allard and Hansche, 1964; Allard, 1999). In general, these authors verified that natural selection increased the frequency of the alleles that favour adaptation to each environment. In relation to reverse selection seen in loci Pvtaaa003 and PVttc002, it could have occurred due to selection dependent on allele frequency when the adaptability of the genotype that is less common increases, as observed in Allard (1999). This phenomenon is considered important in maintaining variability in the population. An equivalent effect also occurred and corresponded to maintenance of excess heterozygotes in some loci. The predominance of natural selection favoring alleles of the Carioca MG parent agrees with the fact that the majority of the area cultivated with common bean in Brazil is planted with this type and indicates not just its better acceptance but also its better adaptability. High productivity of the Carioca also extends to various other countries because of its greater tolerance to acid soils, especially in the case of Brazil (Singh, 1992). The relative fitness coefficients (ω1) were estimated for the homozygote genotypes related to each primer pair for better understanding the effect of natural selection. For example, considering “A1” to be the allele from the Carioca MG parent and “A2” the allele from the ESAL 686 parent, ω2 was estimated for A1A1 and ω3 for A2A2. The relative fitness coefficient of the A1A2 heterozygote, ω2, was considered to be equal to 1.0 (Allard and Hansche, 1964). Estimates of ω1 and ω3 equal to 1.0 indicate that natural selection did not take place for these genotypes, that is, they had the same reproductive efficiency as the heterozygote (Allard and Hansche, 1964). Estimates of ω1 and ω3 less than 1.0 indicate that natural selection took place, reducing the frequency of these genotypes in relation to the heterozygote, which was more adapted and inversely, estimates larger than 1.0 indicate that selection increased the frequency of the homozygotes in relation to the heterozygote, which in this case is less adapted (Allard, 1999). Accumulated Relative fitness coefficients for A1A1 (ω1) from F7 to F8 (Table 3) varied from 0.0005 to 2.4519 and for A2A2 (ω3) varied from 0.0010 to 0.227. The value zero occurs when no locus of the evaluated genotype is observed, as in the case of the PvM13 primer (A1A1 = 0 and ω1 = 0). It is important to remember that these accumulated coefficients refer to the effect of natural selection on the homozygotes from generation F2 to F8, during six generations. It is noted that there is a larger variation of ω1 when compared with ω3, which shows a larger oscillation of the relative fitness coefficients in the different loci, with values higher than 1. These values higher than one show that for the BMd-33, PVct002 and PvM15 loci, the homozygote with the highest value adapted better than the heterozygote; however, for the rest of the loci, the ω1 and ω3 estimates were less than 1.0, showing that heterozygote combination was superior. Average ω1 accumulated fitness coefficient estimates (0.368468) were higher than ω3 (0.0494349), showing that selection was more intense on the homozygote for the allele from the ESAL 686 line (A2A2). These estimates, just as those obtained for each locus, confirm better adaptation for the majority of the homozygotes for alleles from the Carioca MG parent. Due to the absence of heterozygote individuals, it was not possible to estimate accumulated fitness coefficient ω1 and ω3 for the following loci: BMb-2, BMd-20, BMd-26, and Pvtaaa003. For the accumulated relative fitness coefficients in F23 to F24, there was a variation from zero to 0.3719378 for ω1 and a variation from zero to 0.4458374 for relative fitness coefficient ω3 (Table 3). In this case, ω1 and ω3 estimates include the effect of natural selection on the homozygotes from generation F8 to F24, during 16 generations, 2.67 times the number of generations when compared to the estimates for F8. Taking note that a greater amplitude of ω3 estimates (0.4458374) when compared to those of ω1 (0.3719378), imply greater oscillation of the relative fitness coefficients to A2A2 in the different loci. Comparing ω1 and ω3 averages of F24 and F8, the same effect of natural selection is observed though at a lower intensity, probably because the more extreme genotypic frequencies in F24 than in F8. This reduced intensity can also be explained by reverse selection in some loci and maintenance of the intense heterozygosis in other loci; natural selection depending on low genotypic frequency may even have taken place. Considering both generations, the effect of natural selection was more accentuated in the first segregant generations, as Allard (1999) observed, also because the genotypic frequencies were more similar due to the greater frequency of unfavourable alleles. Also in F24, due to the absence of heterozygotes, it wasn’t possible to estimate the accumulated relative fitness coefficients for the following primers: BMd-20, BMd-26, BMd-33, and Pvtaaa003. Despite not having detected heterozygotes in 4 loci of F8 and 4 loci of F24, the expected heterozygote frequency without natural selection is 0.0124 at F8 and 0.005 at F24, starting with pure and contrasting parents. When one of the parents is a heterozygote, the expected heterozygote frequency is 0.011237 at F8 and 0.003731 at F24. Such frequencies happen because the species mainly reproduces by self-fertilization in the environmental conditions in which the populations were evaluated. Therefore the frequencies of loci in which heterozygotes were observed in a sample of 107 plants were still higher with loci BMd-1, BMb-9, BMd-45, PVttc002, BMd-15, BMd-16, and PvM13 and especially at F24, again showing the superiority of heterozygote adaptation in the genomic regions around these loci (Table 1). According to Allard and Hansche (1964), the effect of natural selection favouring maintenance of heterozygotes contributed to retain genetic variability in the population. The populations utilized in this work were evaluated for grain yield in the progenies at various generations, and showed a far larger gain with natural selection than the artificial selection (Gonçalves et al. 2001; Corte et al. 2002; Silva et al. 2004). Therefore the increase in grain yield due to natural selection even after many generations of self-fertilization is the result of the better adaptive value of the loci in heterozygosis for this trait. Consequently, it can be inferred that the high number of microsatellite heterozygote loci at advanced generations of self-fertilization must also refer to regions of the genome that contribute to better adaptation, especially the alleles of the Carioca MG parent. So the microsatellite fragments chosen by natural selection can be utilized to perform assisted selection, as suggested by Allard (1999) and Rodrigues and Santos (2006). Thus homozygote genotypes chosen by natural selection could contribute to better adaptability in lines to be selected. Therefore it was verified among the SSR fragments if some are associated to grain yield. The results of simple and multiple linear regression analysis utilizing the backward model for the grain yield are on Table 4 and Table 5, respectively. The adjusted determination coefficient values (R2) obtained by the markers considering simple linear regression were low, varying from 2.74% to 11.76%, indicating that these markers explain a reduced part of the phenotypic variation (Table 4). Note that in the backward method, some markers identified by linear regression weren’t identified in multiple regression and vice versa. However, this result was expected since the method only selects the minimum number of markers needed to explain the phenotypic variation. With this procedure, the amount of phenotypic variation explained was equally low. This fact is common; as stated in Bernardo (2008), 72% of the QTLs mapped in various studies for quantitative traits such as grain yield explained less than 10% of phenotypic variation, corroborating the present result. It is important to remember that the markers used were selected by natural selection during the generations of bulk populations and their efficiency can be reduced to identify QTLs. However, the deviation from the expected segregation is not always prejudicial (Hackett and Broadfoot, 2003). QTLs interacted heavily with the environment, as can be seen when there is a differential expression of QTLs in relation to environmental changes, or when there is no QTL expression in some of the environments evaluated (Campbell et al. 2003; Torga et al. 2010). This interaction can be verified by observing that in different harvests in the two generations, different markers were found that explained some of the variation of grain yield. It was also observed that in the winter evaluation of the F24 progenies, there was no marker that could explain part of grain yield. Also, this interaction may explain the results of joint multiple regression analysis of F8 at which no marker identified QTL and of F24 three markers together explained 15.84% of grain yield variation (Table 5). It is again necessary to remember that this apparent interaction could also be the selection effect that altered the frequency of the markers in both generations. The fact that QTLs interacted with the environment could also be explained by the variation in R2 estimates for the same marker in different evaluations, as happened for the PVttc002 marker with R2 values varying from 0 to 11.76%. The magnitudes and the instability of QTL expression detected confirmed the difficulty of assisted selection since it is generally done for the purpose of utilizing the lines in several environments. Of the markers affected by natural selection and chosen by the backward method, in each season and at each generation, some contributed to increased yield and others reduced expression of this trait (Table 6). For example, BMd-1 and BMd-9 together contributed 11.63% toward increase grain yield in the winter at generation F8 and BMd-45 and PvM-15 reduced yield in the rainy and dry seasons, respectively. At generation F24, in winter, no marker was identified, but in the rainy season four markers, BMd-26, AJ416402, BMd-45 and PVttc002 were chosen that individually explained a small part of the yield variation, but together explained 30.74% of the variation, with three of them increasing yield and BMd-45 reducing it. It is worth stressing the high level of interaction among QTLs and environments, since these same primers did not explain the same amount of variation in any other season. However, in the joint analysis two other markers along with BMd-45 explained a smaller amount of yield variability. The high level of interaction for the grain yield QTLs with the environment has been detected many times including in common bean (Pereira et al. 2007; Rodrigues et al. 2007; Torga et al. 2010). Therefore, natural selection acted in all of the 22 microsatellite loci and the frequency of the best adapted parental alleles increased in 22 of the loci in F8 and 19 loci in F24. The intensity of natural selection was different for each locus and each generation. Besides, there are markers influenced by natural selection that explain the effect of QTLs of grain yield, although the expression of the QTLs is generally unstable and interacts strongly with the environments, seasons and generations, and could have been increased by natural selection. ALLARD, R.W. and HANSCHE, P.E. (1964). Some parameters of population variability and their implications in plant breeding. Advances in Agronomy, vol. 16, p. 281-325. [CrossRef] ALLARD, R.W. (1999). Principles of plant breeding. 2th ed. New York, John Wiley & Sons, 254 p. ISBN 978-0-471-02309-8. BERNARDO, R. (2008). Molecular markers and selection for complex traits in plants: Learning from the last 20 years. Crop Science, vol. 48, no. 5, p. 1649-1664. [CrossRef] BLAIR, M.W.; PEDRAZA, F.; BUENDIA, H.F.; GAITAN-SOLÍS, E.; BEEBE, S.E.; GEPTS, P. and TOHME, J. (2003). Development of a genome-wide anchored microsatellite map for common bean (Phaseolus vulgaris L.). TAG Theoretical and Applied Genetics, vol. 107, no. 8, p. 1362-1374. [CrossRef] BLAIR, M.W.; IRIARTE, G. and BEEBE, S. (2006). QTL analysis of yield traits in an advanced backcross population derived from a cultivated Andean x wild common bean (Phaseolus vulgaris L.) cross. TAG Theoretical and Applied Genetics, vol. 112, no. 6, p. 1149-1163. [CrossRef] BENBOUZA, H.; JACQUEMIN, J.M.; BAUDOIN, J.P. and MERGEAI, G. (2006). Optimization of a reliable, fast, cheap and sensitive silver staining method to detect SSR markers in polyacrylamide gels. Biotechnology, Agronomy, Society and Environment, vol. 10, no. 2, p. 77-81. CAIXETA, E.T.; BORÉM, A. and KELLY, J.D. (2005). Development of microsatellite markers based on BAC common bean clones. Crop Breeding and Applied Biotechnology, vol. 5, no. 2, p. 125-133. CAMPBELL, B.T.; BAENZIGER, P.S.; GILL, K.S.; ESKRIDGE, K.M.; BUDAK, H.; ERAYMAN, M.; DWEIKAT, I. and YEN, Y. (2003). Identification of QTLs and environmental interactions associated with agronomic traits on chromosome 3A of wheat. Crop Science, vol. 43, no. 4, p. 1493-1505. [CrossRef] CORTE, H.R.; RAMALHOL, M.A.P.; GONÇALVES, F.M.A. and ABREU, Â.F.B. (2002). Natural selection for grain yield in dry bean populations bred by the bulk method. Euphytica, vol. 123, no. 3, p. 387-393. [CrossRef] GONÇALVES, F.M.A.; RAMALHO, M.A.P. and ABREU, Â.F.B. (2001). Natural selection for common bean traits. Crop Breeding and Applied Biotechnology, vol. 1, no. 3, p. 213-220. HACKETT, C.A. and BROADFOOT, L.B. (2003). Effects of genotyping errors, missing values and segregation distortion in molecular marker data on the construction of linkage maps. Heredity, vol. 90, no. 1, p. 33-38. [CrossRef] HANAI, L.R.; SANTINI, L.; CAMARGO, L.E.A.; FUNGARO, M.H.P.; GEPTS, P.; TSAI, S.M. and VIEIRA, M.L.C. (2010). Extension of the core map of common bean with EST-SSR, RGA, AFLP, and putative functional markers. Molecular Breeding, vol. 25, no. 1, p. 25-45. [CrossRef] PEREIRA, H.S.; SANTOS, J.B.; ABREU, Â.F.B. and COUTO, K.R. (2007). Informações fenotípicas e marcadores microssatélites de QTL na escolha de populações segregantes de feijoeiro. Pesquisa Agropecuária Brasileira, vol. 42, no. 5, p. 707-713. [CrossRef] PEREIRA FILHO, I.A. and CAVARIANI, C. (1984). Taxa de hibridação natural do feijoeiro comum em Patos de Minas, Minas Gerais. Pesquisa Agropecuária Brasileira, vol. 19, no. 9, p. 1181-1183. RODRIGUES, T.B. and SANTOS, J.B. (2006). Effect of natural selection on common bean (Phaseolus vulgaris) microsatellite alleles. Genetics and Molecular Biology, vol. 29, no. 2, p. 345-352. [CrossRef] RODRIGUES, T.B.; SANTOS, J.B.; RAMALHO, M.A.P.; AMORIM, E.P. and SILVA, N.O. (2007). Identificação de QTLs em feijoeiro por meio de marcadores SSR influenciados pela seleção natural. Ciência e Agrotecnologia, vol. 31, no. 5, p. 1351-1357. [CrossRef] SILVA, H.D. and VENCOVSKY, R. (2002). Poder de detecção de "Quantitative Trait Loci", da análise de marcas simples e da regressão linear múltipla. Scientia Agricola, vol. 59, no. 4, p. 755-762. [CrossRef] SILVA, N.O.; RAMALHO, M.A.P.; ABREU, Â.F.B. and CARNEIRO, J.E.S. (2004). Performance of common bean families after different generations under natural selection. Genetics and Molecular Biology, vol. 27, no. 4, p. 574-578. [CrossRef] SINGH, S.P. (1992). Common bean improvement in the tropics. In: JANICK, J. ed. Plant Breeding Reviews, vol. 10. New York, J. Wiley. p. 199-269. [CrossRef] TORGA, P.P.; SANTOS, J.B.; PEREIRA, H.S.; FERREIRA, D.F. and LEITE, M.E. (2010). Seleção de famílias de feijoeiro baseada na produtividade, no tipo de grão e informações de QTLs. Ciência e Agrotecnologia, vol. 34, no. 1, p. 95-100. Note: Electronic Journal of Biotechnology is not responsible if on-line references cited on manuscripts are not available any more after the date of publication. |