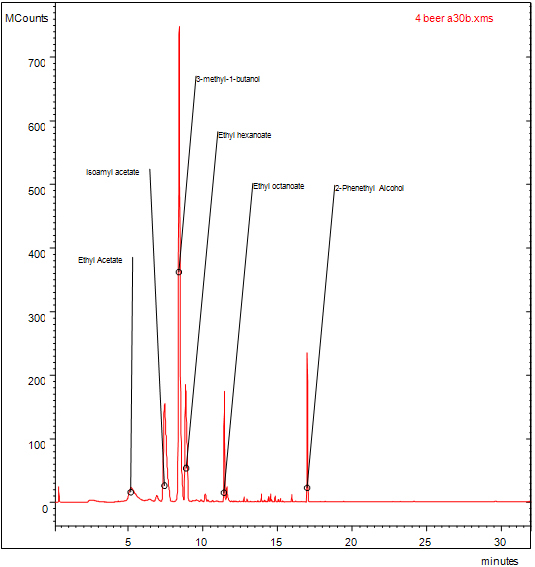
Fig. 4 GC-MS Chromatogram of beer samples showing the different peaks representing the beer volatile compounds.