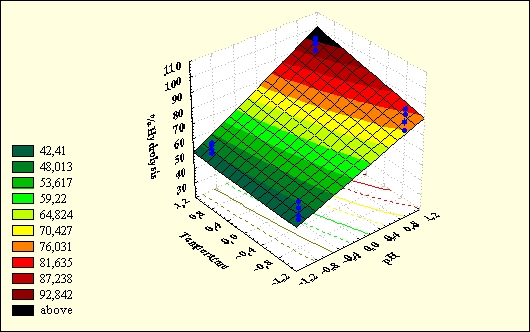
Figure 3. Hydrolysis percentage profile as a function of pH and temperature.
Supported by
UNESCO
/
MIRCEN
network
Home
|
Mail to Editor
|
Search
|
Archive