
|
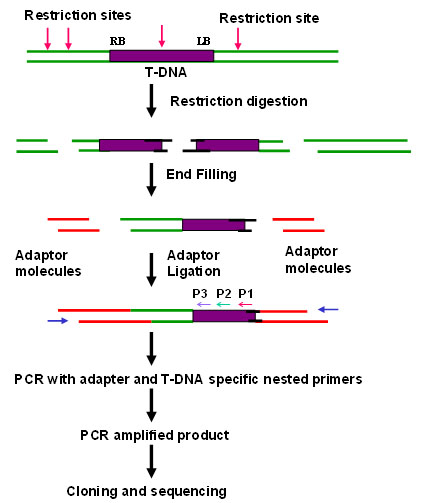
| Figure 8. Schematic representation of adaptor PCR. Specific adaptor molecules are ligated to the ends of the restricted DNA fragments carrying part of the insert. The restricted fragments are end filled and subjected to PCR using primers specific to the adaptor region and nested primers specific to T-DNA. The flanking plant DNA region is represented by line (green). The adaptor molecules are shown in red. The adaptor specific primer is shown in blue arrow. The T-DNA specific nested primers (P1, P2 and P3) are indicated by red, green and purple arrows, respectively. |
|
|