
|
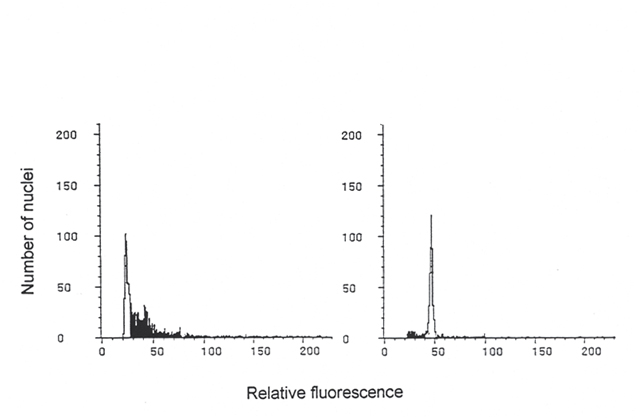
| Figure 2. Peaks obtained by the flow cytometry analysis of a colchicine treated plant (right), and an untreated colchicine control (left). The right peak mode is 47, their mean is 46.59 and the variation coefficient: 2.68%. For the left peak the mode was 23. Their mean: 23.45 and the variation coefficient 5.33%. |
|
|