| Figure
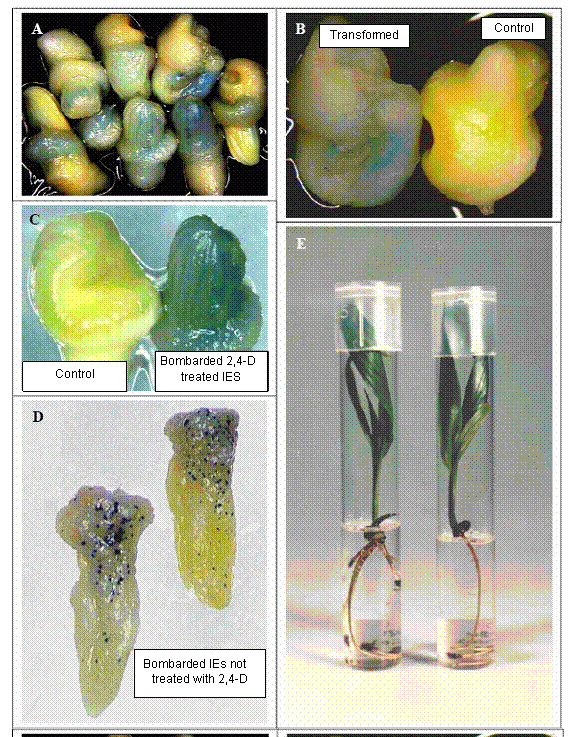
2. gusA expression patterns observed between transformed
IEs treated with 2,4-D and those not treated with 2,4-D prior to bombardment.
(A)
Randomly selected IEs assayed for gusA activity.
(B) In the
presence of the gusA gene, substrate produced blue deposits as
indicated by blue stains observed in successfully transformed cells and
tissues. On the other hand, the absence of blue stain indicates the absence
of gusA gene, which failed to produce blue deposit.
(C) Shades
of blue stains (indicating gusA expression) were detected on transformed
IEs spreading over the entire IEs treated with 2,4-D prior to bombardment.
Prominent longitudinal blue stains probably along vascular bundles were
also detected in 2,4-D treated IEs. No blue spot or stains were detected
on all non-transformed sample (control).
(D) Only localized
blue spots (distinct and isolated) were observed on IEs not treated with
2,4-D prior to bombardment. (E)Plantlets regenerated showed no difference
in growth between those from double bombarded IEs (left) and from single
bombardment (right).
|