
|
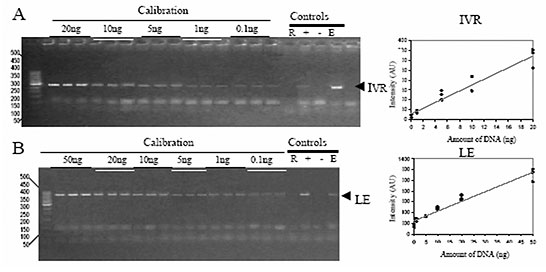
| Figure 1. Analysis of the amount of maize (A) or soybean (B) DNA in the different food samples. Calibration curves were performed with different amounts of Bt 176 maize or RR soybean DNA with the primers IVR and LE, respectively. The used controls were: reactives (R); positives Bt 176 or RR soy DNA (+); negative no GMO DNA (-); DNA extraction (E). |
|
|