
|
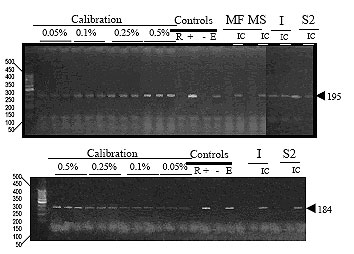
| Figure 2. Analysis of 35S promoter and CRY genes in food samples. The calibration curve was made with mixed flours containing diferent amounts of Bt176 maize. Four controls were performed: reactives (R); Bt 176 DNA (+); DNA no GMO (-); extraction (E). Samples: MF: maize flour; S2: maize starch 2; SN: maize snack; I: ice-cream; IC: inhibitor control. |
|
|