Figure
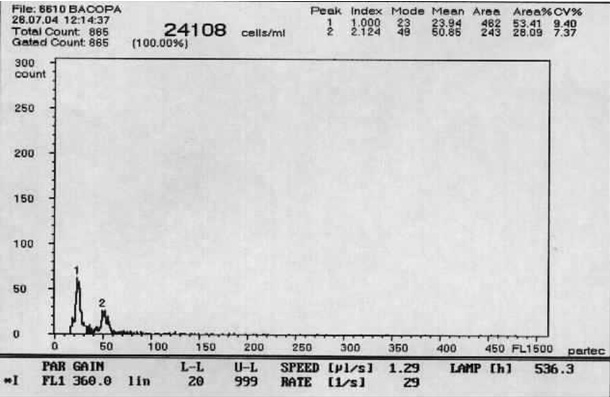
2. Profiles obtained
by flow cytometry of a mixture of a diploid plant and a putative tetraploid
one. The peak indicated as 1 corresponds to the control without treatment,
and the peak indicated as 2 corresponds to a plant treated with a
colchicine dose of 0.001% 48 hrs.