
|
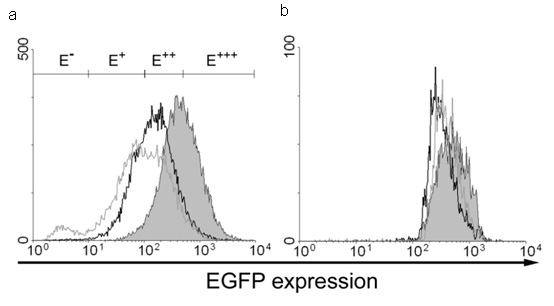
| Figure 2. EGFP expression in transduced SupT1 cells. Flow cytometric EGFP expression profile of SupT1 cells, transduced with virus encoding single Rac2 shRNA (filled histograms), tandem Rac2 and Rac1 shRNA (black line) and triple Cdc42, Rac2 and Rac1 shRNA (grey line) before (a) and after (b) sorting for EGFP expression. Markers E- to E+++ indicate expression intervals used in chemotaxis experiments (see text and Figure 5). |
|
|